Library Statistics
Library Statistics provides a visual overview of your collection through interactive charts. Access it from the stats button in the top bar.
Overview
Section titled “Overview”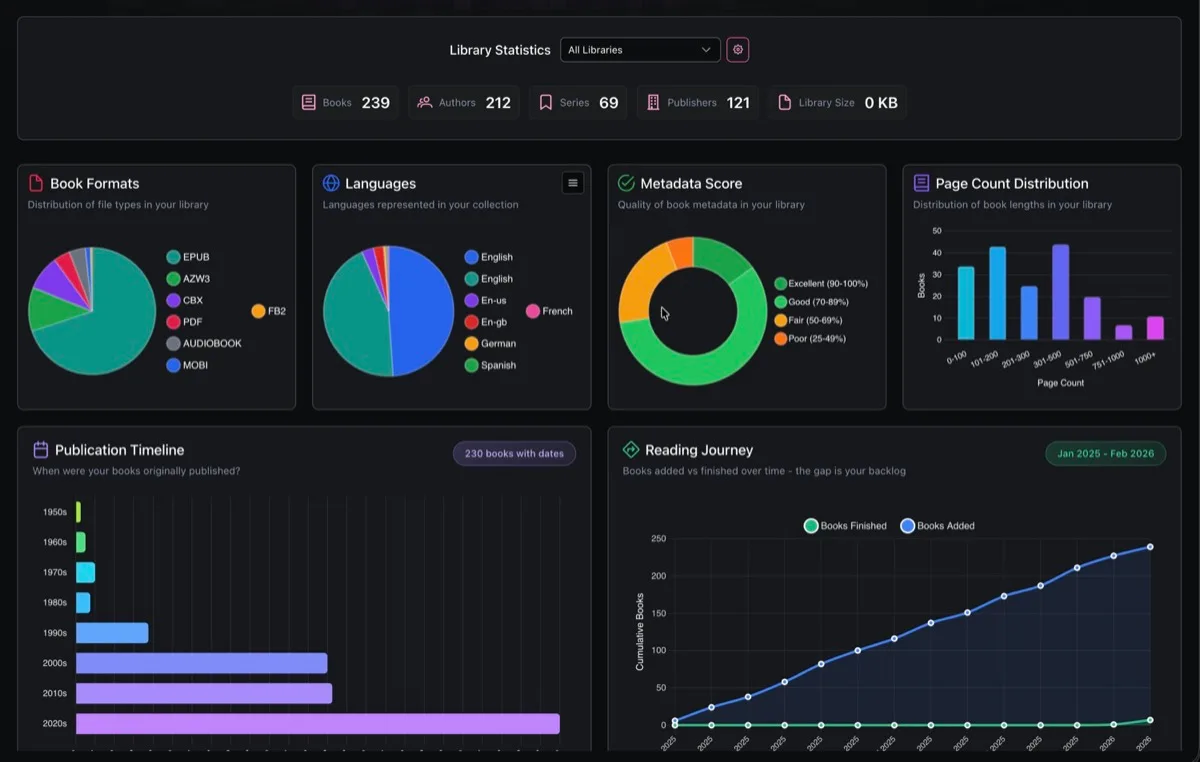
The top section shows summary counts for your collection: total Books, Authors, Series, Publishers, and Library Size.
A library filter dropdown lets you scope all charts to a specific library or view stats across all libraries.
Charts
Section titled “Charts”Nine chart types are available. Each chart includes hover tooltips and contextual insights (peak values, averages, trends).
-
Book Formats: Distribution of file formats (EPUB, PDF, CBX, MOBI, FB2, Audiobook, etc.).
-
Languages: Languages represented in your collection.
-
Metadata Score: Quality of book metadata rated from Excellent to Very Poor.
-
Page Count Distribution: Books grouped by page ranges (0-100, 101-200, up to 1000+).
-
Publication Timeline: Books grouped by decade (Pre-1900 through 2020s).
-
Publication Trend: When the books in your collection were originally published, plotted year by year. Reveals whether your taste skews modern or classic, highlights peak publication years, and surfaces patterns like a heavy concentration in a particular era. Helpful for readers who want to diversify the time periods they read from.
-
Reading Journey: Tracks your library growth alongside your reading progress over time. The two lines show how fast you’re adding books vs finishing them, making the growing (or shrinking) gap between them your reading backlog. Useful for spotting whether you’re keeping up with your acquisitions or falling behind, and for identifying your most productive reading periods.
-
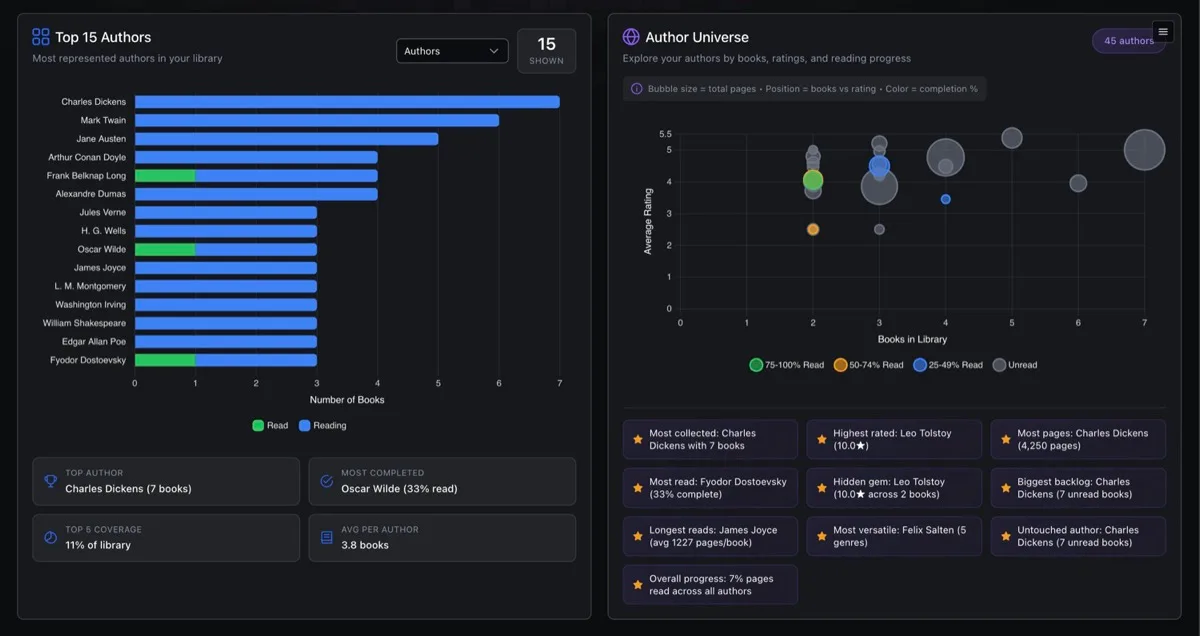
Top Items: Ranks the most represented authors, categories, series, publishers, tags, or moods in your library, with each bar broken down by read status. Lets you quickly see not just what you have the most of, but how much of it you’ve actually read. The category switcher makes it easy to slice your collection from different angles.
-
Author Universe: A bird’s-eye view of your relationship with every author in your collection. Each bubble represents an author, positioned by how many books you own and how highly they’re rated, with bubble size reflecting total page count. Color coding shows how much of each author’s work you’ve actually read. Great for discovering which authors dominate your shelves, finding highly-rated authors you haven’t started yet, and spotting your biggest unread backlogs.
Customization
Section titled “Customization”- Toggle charts on or off using the config button in the header
- Drag to reorder charts using the drag handles
- Switch categories in the Top Items chart via a dropdown (Authors, Categories, Series, Publishers, Tags, Moods)
Chart layout preferences are saved per user.